
More Information
Submitted: August 25, 2023 | Approved: August 31, 2023 | Published: September 01, 2023
How to cite this article: Benedict R. Utilization of Molecular Simulation Applications for Stability Testing of Anthocyanin Compounds in Black Elderberry. Arch Biotechnol Biomed. 2023; 7: 012-017.
DOI: 10.29328/journal.abb.1001035
Copyright License: © 2023 Benedict R. This is an open access article distributed under the Creative Commons Attribution License, which permits unrestricted use, distribution, and reproduction in any medium, provided the original work is properly cited.
Keywords: Anthocyanins; Molecular simulation; Stability

Utilization of Molecular Simulation Applications for Stability Testing of Anthocyanin Compounds in Black Elderberry
Richard Benedict*
Brawijaya University, Indonesia
*Address for Correspondence: Richard Benedict, Brawijaya University, Indonesia, Email: [email protected]
Recently, many studies on the molecular activity of compounds have been carried out using simulations through computer programs or in silico simulations. Anthocyanins are one of the compounds that are often used as food coloring agents and can function as antioxidants to prevent blockage of blood vessels, as an anti-cancer that can prevent the development of cancer cells and tumors and have anti-inflammatory effects. The purpose of the research is to determine the stability of anthocyanins using molecular simulations and determine the best mixing sequence of ingredients to produce the most stable anthocyanin mixture.
Based on the results of the simulations carried out, it can be proven that the final 3 sets (the modeled compound belonging to namely AP and AZ followed by a number based on the simulation order) selected are AP17, AP18, and AZ17. The AP17 set had the lowest potential energy at the end of molecular dynamics simulations, but molecular visualization showed structural instability indicated by the formation of gaps in the molecular conformation. The AP18 set had the second lowest potential energy at the end of molecular dynamics simulations and molecular visualization showed molecular conformation that tended to be stable during molecular simulations with no change in structure. The AZ17 set had the highest potential energy of the final 3 sets selected and molecular visualization showed a gap in the conformation at the beginning of the simulation, but over time the gap became denser, indicating that the molecule became more stable over time.
Based on the research results, the AP18 set was chosen because it has relatively low potential energy and it can be proven that the structure visualization of this set tends to be more stable over time during molecular dynamics simulations.
In this digital era, internet access is available everywhere and technology to perform high-level computing has begun to develop so that many simulation and computing programs are made in silico specifically designed for various types of research fields. The term in silico refers to the use of computers in computational, computational research of complex structures of biomolecules that require mathematical descriptions and computer simulations of the continuous action of various gene products [1].
Computer-based in silico simulation techniques have become standard equipment to facilitate the interpretation of experimental data at the atomic and molecular levels [2]. The complexity of a molecular system makes the calculations carried out take a long time depending on the size of the system to be tested so that adequate computational facilities are needed to perform a complex calculation.
Anthocyanin is a compound used in the food industry as a food coloring and is found in many types of berries, one of which is black elderberry (Sambucus nigra), where anthocyanins play a role in giving color to various berries. Among the various types of flavonoids, water-soluble glycosides and acyl-glycosides present in anthocyanins constitute an important group of natural antioxidants [3]. Juice extracted from elderberry and black currant is known to have a high anthocyanin content but its use as a dye is very limited due to the stability of anthocyanins which are known to be quite low which is influenced by several factors such as pH in a system; some anthocyanin-degrading agents in food (such as oxygen, ascorbic acid, and sugar); sugar degradation products; enzyme; water activity; and the concentration of anthocyanins used [4]. The purpose of this study was to determine the stability of anthocyanins from black elderberry extract using molecular simulations and determine the best mixing order of ingredients to produce the most stable anthocyanin solution mixture.
Tool
The tool used in this study is an ASUS X450CC series Laptop with the following hardware specifications: 10 GB RAM, Intel Core i3-3217U CPU, Nvidia GeForce GT 720 M GPU with Windows 10 Enterprise OS version 21H2. Schrodinger Suites 2021-2 software which includes the following modules: AutoQSAR, Bioluminate, Desmond, Field-Based QSAR, Glide, Induced Fit Docking, Jaguar, KNIME, LigPrep, MacroModel, PLDB, Prime, PrimeX, QikProp, QSite, SiteMap was used to run the simulation. Thermo-scientific magnetic stirrer hotplates are used to homogenize materials. Mettler-Toledo analytical balance for weighing materials to a predetermined weight. Pyrex baker glass 500 mL as a container homogenizes the material. Mercury thermometer to measure temperature during the running process.
Material
The ingredients used for this study were black elderberry juice extract as an ingredient to be tested for stability, zinc picolinate as a source of zinc active ingredients, glycerin as a lubricant, sugar as a sweetener, xanthan gum as a thickening agent, potassium sorbate as a preservative, citric acid as a flavoring agent, sodium citrate as a buffering agent and aquadest as a solvent.
Research design
The study was conducted using Group Randomized Design (RAK) with two factors in each set of experiments. The first factor is the time in picoseconds of 20, 40, 60, 80 and 100 ps. The second factor is the composition in each experimental set, namely the composition of zinc picolinate anthocyanin (AZ), potassium sorbate anthocyanin (AP), and sodium citrate anthocyanin (AS). This research was carried out in pairs with a total of 2, 3, 4, 5, 6, 7, and 8 pairs then the best 3 sets were selected from each composition to be simulated to the next pair so that 3 sets with the best combinations were obtained at the end of the simulation.
Stages of research
Weight weighing of black elderberry juice extract and other ingredients: The weighing of ingredients was carried out using the following analytical balances: 60 mg of black elderberry juice extract, 945 mg of zinc picolinate, 50 g of glycerin, 150 g of sugar, 500 mg of xanthan gum, 1 g of potassium sorbate, 2 g of citric acid, and 2 g of sodium citrate.
Homogenization of black elderberry juice extract and other ingredients: Aquadest as much as 100 mL are poured into a 500 mL glass baker then the weighed ingredients are homogenized with a magnetic stirrer hotplate for 10 minutes for each ingredient in the following order: citric acid, sucrose, xanthan gum, zinc picolinate, black elderberry juice extract, potassium sorbate and sodium citrate. Then add aquadest until the weight of the solution reaches 400 mL.
Visual evaluation of anthocyanin stability: The homogenized solution was placed at a temperature of 250 0C and then a visual analysis was carried out at the beginning after the solution was made and after 2 weeks to see the visual change during the stability test on the anthocyanin content in the solution which was characterized by color changes.
Collection of molecular structure data from database sites: Data related to the 3D molecular structure of the materials used in the simulation were taken from several websites of trusted institutions that provide such information, namely DrugBank (https://go.drugbank.com/) and PubChem (https://pubchem.ncbi.nlm.nih.gov/). The data is downloaded in .pdb format for use in simulations.
Molecular structure model assembly: The 3D molecular structure data of each material that has been downloaded is then transferred into simulation software, namely Schrodinger Suites 2021-2 to then be put together in a workspace in the software. The number of molecules used in the simulation was determined using Avogadro's calculation of the number of moles by the formula:
Due to hardware limitations, some of the results of calculating the number of molecules used in the simulation are adjusted so that the simulation can be run. Laying molecules in the workspace needs to pay attention to the distance between molecules so as not to collide but still at a fairly close distance from each other, this is to anticipate that there will be no errors in the next stage of simulation.
Energy minimization of structures: The 3D molecular structure that has been entered in the workspace is then carried out by an energy minimization process using the MacroModel > Minimize module available in the Schrodinger Suites 2021-2 software using a maximum iteration of 130,000. Energy minimization is carried out until the formation of the molecular structure is stable enough which can be judged by changes in its conformational shape.
Molecular dynamics simulation: Molecular dynamics simulations were carried out using the MacroModel > Dynamic module in Schrodinger Suites 2021-2 software. The simulation is carried out with the following settings: the force field used is OPLS_2005, solvent is not used then set to none, the method used is stochastic dynamic, SHAKE is set to all bonds, the simulation temperature used is 298.1 K, and the simulation time is set to 0, 20, 40, 60, 80 and 100 ps.
Data analysis of simulation results: Data generated from molecular dynamics simulations in the form of potential energy from molecular structure formation and visualization of molecular structure shape after undergoing molecular dynamics. The data is then analyzed using the graph feature in Microsoft Excel 2019 software to analyze the relationship between time and molecular potential energy. The potential energy obtained from the simulation results was also carried out ANOVA analysis with a significance level of 95% (p < 0.05).
Then further tests were carried out using the Tukey Pairwise Test to look for noticeable differences in the data. Tukey Pairwise Test results are expressed in different letter notation in the data if there is a noticeable difference.
Visual observation
Visual observation of the mixed solution of black elderberry extract was carried out by looking at the color change in the solution shortly after mixing and after being allowed to stand at room temperature (25 0C) for 1 week. The color change in the solution is caused by a change in the levels of anthocyanins in the solution. The results of visual observations are shown in Figure 1.
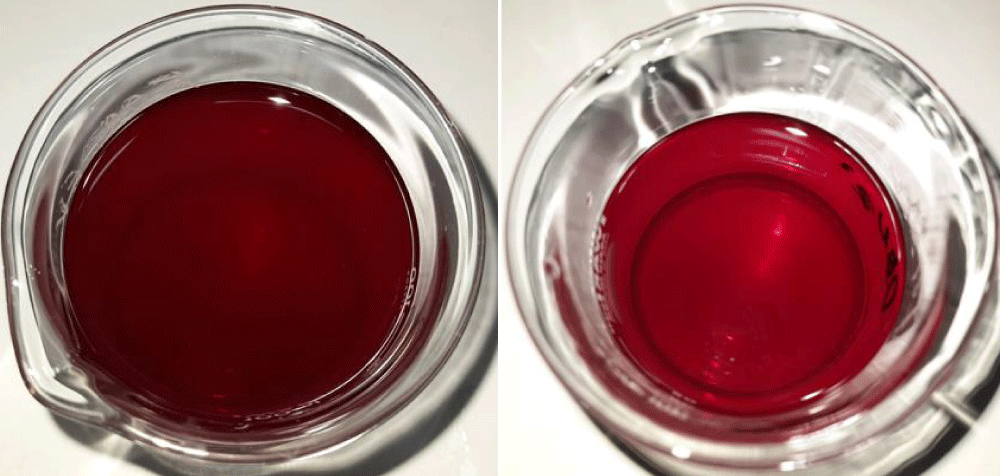
Figure 1: Visual observations on a mixture of black elderberry solution (the left picture is visual shortly after mixing the solution and the right image is visual after being left at room temperature for 2 weeks).
Based on visual observations that have been made, color changes can be seen in the mixture of black elderberry solution. Shortly after mixing, the color conditions in the solution are still dark red, and after being allowed to stand at room temperature for 2 weeks, the color of the solution becomes more faded.
Energy minimization
Molecular energy minimization is carried out on all pairs of molecular structure sequences that have been pre-assembled in Schrodinger Maestro 2021-2 software. In each minimization result, 3 sets with the lowest energy from each group will be taken. The purpose of this energy minimization is to improve the molecular structure so that the initial potential energy of the structure is minimal. The energy minimization stage is carried out with a predetermined maximum iteration option of 130,000. The pairs that have been determined at the time of this minimization consist of 2 pairs to 8 pairs which are assigned into three groups, namely the Elderberry Anthocyanin Zinc Picolinate group with the code name AZ, the Elderberry Anthocyanin Potassium Sorbate group with the code name AP, and the Elderberry Anthocyanin Sodium Citrate group with the US code name and given a numeric number behind the code name based on the simulation sequence number. The final data of the minimization results of the pairs carried out are presented in Table 1.
| Table 1: Final Minimization Results. | |||
| Set Name | Compound | Potential Energy (kJ/mol) | |
| AZ17 | 1 | Elderberry Anthocyanins | 67509.445 |
| 2 | Zinc Picolinate | ||
| 3 | Glycerine | ||
| 4 | Potassium Sorbate | ||
| 5 | Sodium Citrate | ||
| 6 | Citric acid | ||
| 7 | Sucrose | ||
| 8 | Xanthan gum | ||
| AP17 | 9 | Elderberry Anthocyanins | 67493.258 |
| 10 | Potassium Sorbate | ||
| 11 | Zinc Picolinate | ||
| 12 | Glycerine | ||
| 13 | Sodium Citrate | ||
| 14 | Citric acid | ||
| 15 | Sucrose | ||
| 16 | Xanthan gum | 67513.336 | |
| AP18 | 17 | Elderberry Anthocyanins | |
| 18 | Potassium Sorbate | ||
| 19 | Glycerine | ||
| 20 | Zinc Picolinate | ||
| 21 | Sodium Citrate | ||
| 22 | Citric acid | ||
| 23 | Sucrose | ||
| 24 | Xanthan gum | ||
Based on Table 1 of the final minimization results, 3 sets with the lowest minimum potential energy were obtained AZ17 sets with a minimum potential energy of 67,509.445 kJ/mol; AP17 set with a minimum potential energy of 67,509.445 kJ/mol; and set AP18 with a minimum potential energy of 67,493.258 kJ/mol, so that the energy minimization data of 8 pairs shows that set AP17 is the set with the lowest potential energy compared to AZ17 and AP18 sets.
Molecular dynamics
The potential energy value of molecular dynamics data is analyzed using the graph feature in Microsoft Excel with the aim of analyzing the stability of potential energy during the dynamic process. The data used to be analyzed is the data from the dynamics of 8 pairs which include AP17, AP18 and AZ17 sets. Potential energy graph from the data resulting from the dynamics of 8 pairs as shown in Graph 1.
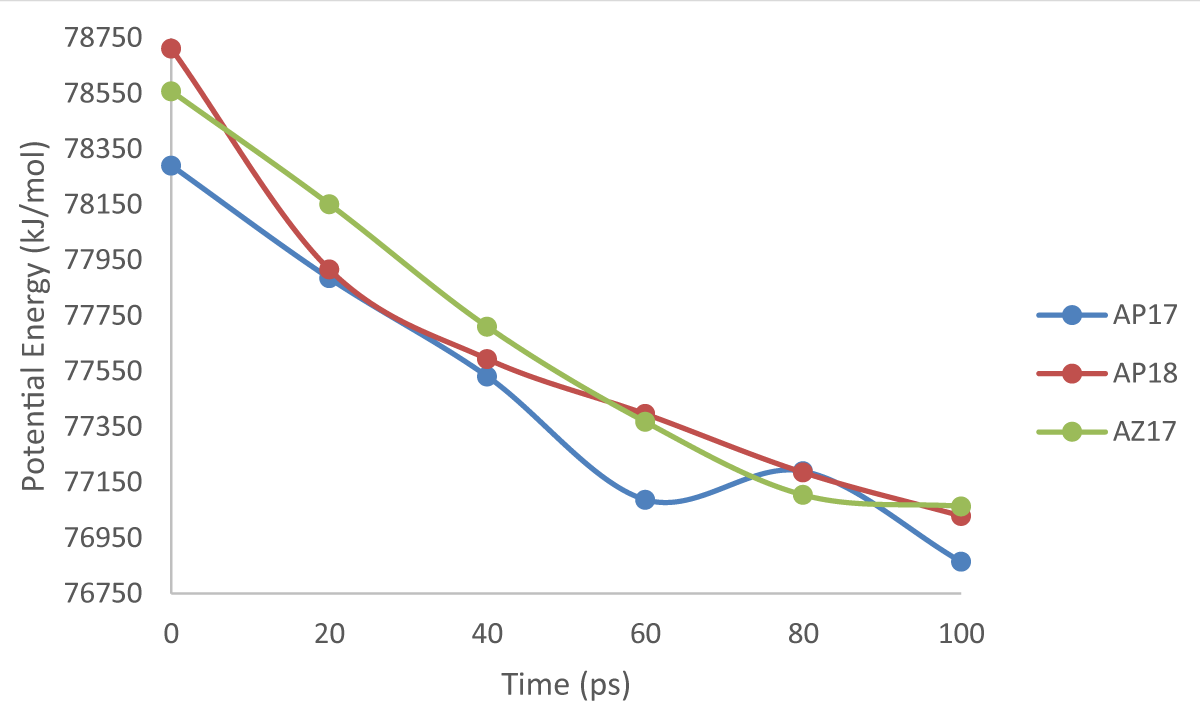
Graph 1: Time and potential energy comparison chart.
Based on the data in Graph 1, it can be seen that the potential energy in the AP17 set decreases energy over the simulation time except for the duration of 60 to 80 ps where the potential energy has temporarily increased from a value of 77,088,274 to 77,190,381 kJ/mol. At the end of the simulation time, the potential energy of the AP17 set had a final value of 76,864.664 kJ/mol. A decrease in potential energy from 0 to 60 ps indicates the molecular structure of the AP17 set which minimizes the potential energy on intermolecular bonds in the structure to achieve structural stability. The increase in energy at 60 to 80 ps is a temporary energy surge experienced during the process of finding the optimal position for the bonds between molecules to achieve stability.
Based on the data in Graph 1, it is known that the potential energy in the AP18 set decreases during the simulation time. The final potential energy value of this set of AP18 is 77,029.675 kJ/mol. The continuous decrease in potential energy indicates that the AP18 set continues to undergo a significant energy minimization process by finding the optimal intermolecular bond position to achieve structural stability.
Based on the data in Graph 1, it is known that the potential energy in the AZ17 set decreased during the simulation time, but the change in potential energy was no longer significant at 80 to 100 ps. The final potential energy value in the AZ17 set is 77,064.116 kJ/mol. A decrease in potential energy at 0 to 80 ps indicates that the structure minimizes potential energy by finding the optimal position for bonds between molecules so that structural stability can be achieved. At 80 to 100 ps the energy minimization reaches saturation which indicates that the potential energy of the AZ17 set is minimum at that value.
Data analysis
Dynamics of molecular structure: Visualization of molecular structure from the final dynamics data is analyzed to find out changes in molecular structure visually. Visualization of the structure was taken for each pair of AP17, AP18 and AZ17 at simulation times of 20, 40, 60, 80 and 100 ps. Changes in structure can be seen in the area circled in the visualized image at any time of molecular dynamics simulation. The results of structural visualization can be seen in Figures 2 to 4.
Based on the results of molecular structure visualization in Figure 2, it can be seen that the molecules in the AP17 set structure become more tenuous as the simulation time goes from 20 to 100 ps. The intermolecular bonds formed in the AP17 set structure are hydrogen bonds marked with yellow dashes. At the beginning of the simulation time of 20 ps, it was seen that the molecules in the structure still looked tight to each other, but over time the simulation saw that gaps began to form between molecules in the structure. At the end of the 100 ps simulation time, it was clear that there were gaps between the molecules, indicating that visually the stability of the AP17 set molecules tended to diminish over time. The change in potential energy in the structure of the AP17 set in Graph 1 is illustrated in this visualization where the potential energy of the AP17 set tends to continue to decrease during the simulation and the visualization of the structure also shows that gaps between molecules widen during the simulation because the molecules in the conformation seek the most balanced position and bond as the simulation progresses, hence the conformation of the molecular structure at the end of this simulation is the most stable conformation for the AP17 set.
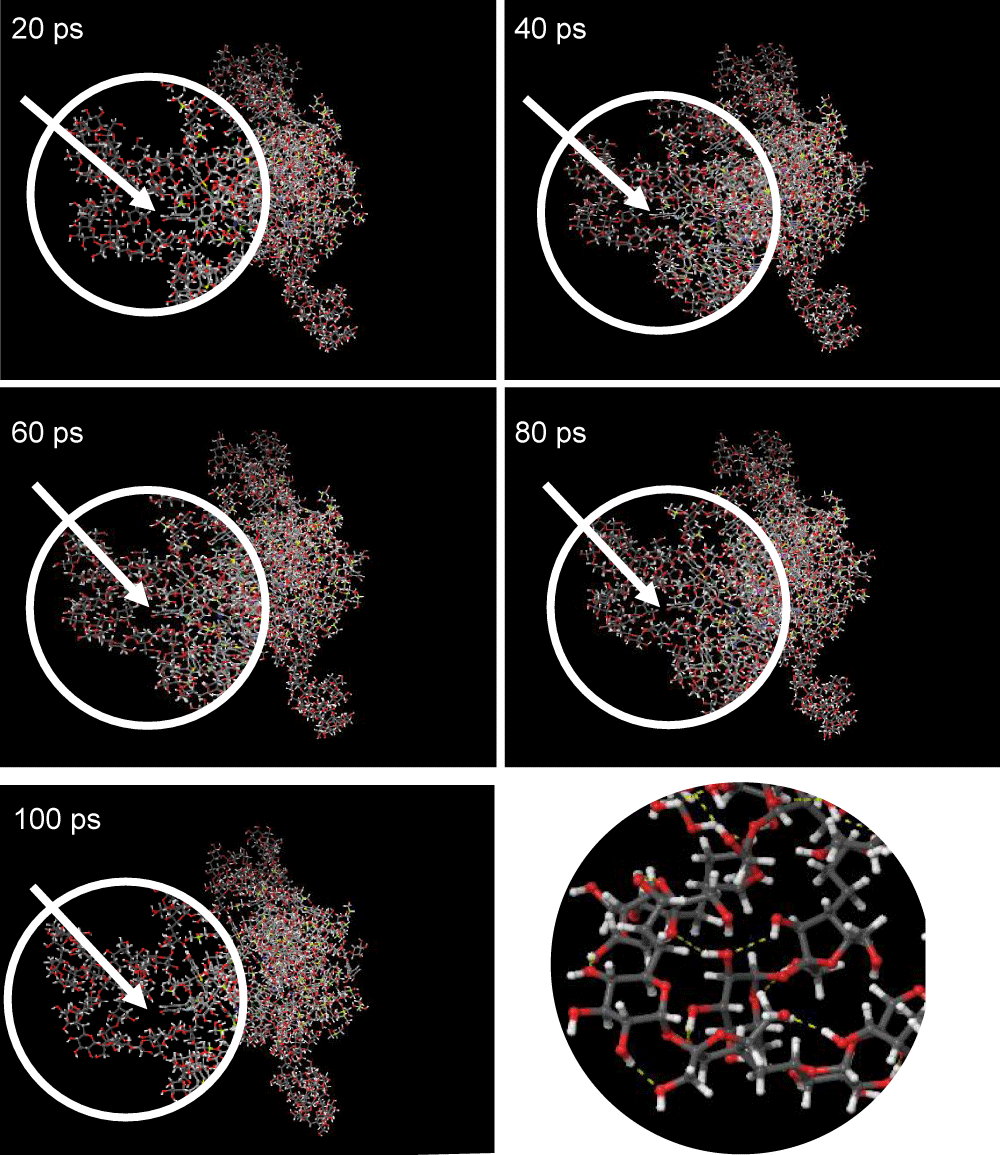
Figure 2: Visualization of AP17 Set structure for 20-100 ps.
Based on the visualization results in Figure 3, it can be seen that the structure of the AP18 set did not undergo significant molecular structure changes during the simulation time interval from 20 to 100 ps. The bonds between molecules formed in the AP18 set structure are hydrogen bonds marked with yellow dashes. All molecules are still bound to each other without any molecules detached or bonded too far, which indicates that visually the AP18 set structure is stable. Changes in potential energy in the structure of the AP18 set in Graph 1 are illustrated in this visualization where the potential energy of the AP18 set tends to continue to decrease during the simulation and visualization of the structure also shows that there is no significant change in the structure during the course which shows that the conformation of the structure is balanced, so the conformation of the molecular structure at the end of this simulation is the most stable conformation share the AP18 set.
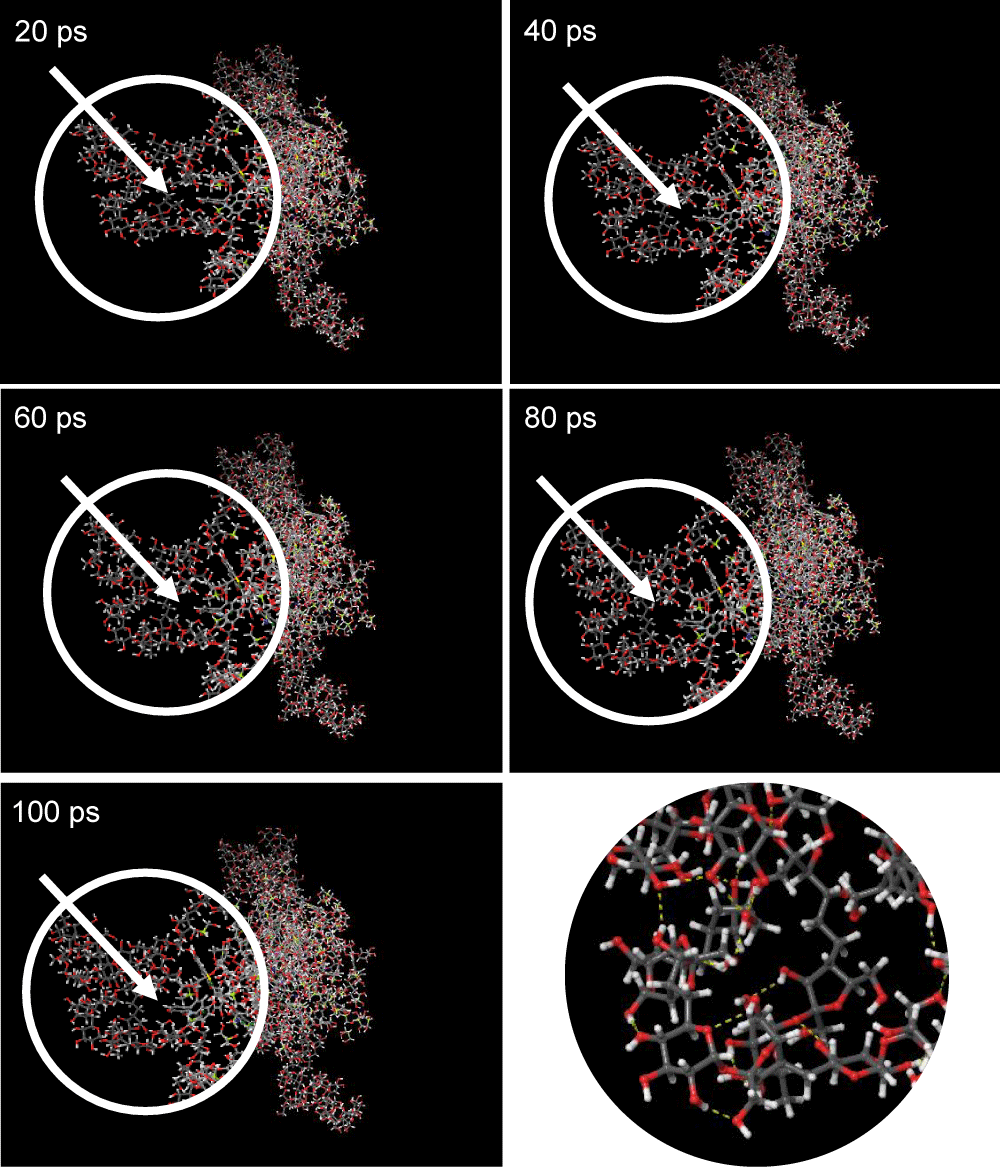
Figure 3: Visualization of AP18 Set Structure for 20-100 ps.
Based on the visualization results in Figure 4, it can be seen that the molecules in the AZ17 set structure are getting closer together and docked during the simulation time interval from 20 to 100 ps. The intermolecular bonds formed in the AZ17 set structure are hydrogen bonds marked with yellow dashes. At the beginning of the 20 ps time, there was a gap between the molecules and each other and over time the gap began to close so that at the end of the simulation time of 100 ps, the entire molecule was getting tighter and the gap between molecules was almost invisible. This shows the process of stabilizing the molecular structure of the AZ17 set which is clearly visible visually where the density of the molecules indicates that the interactions that occur between molecules become stronger over time simulation. The change in potential energy in the AZ17 set structure in Graph 1 is illustrated in this visualization where the potential energy of the AZ17 set tends to continue to decrease during the simulation and the visualization of the structure also shows that the gap between molecules created at the beginning of the simulation slowly begins to become tight as the simulation progresses, this shows the position and bonds between molecules in the AZ17 set structure becoming more balanced, hence the conformation of the molecular structure at the end of this simulation is the most stable conformation for the AZ17 set.
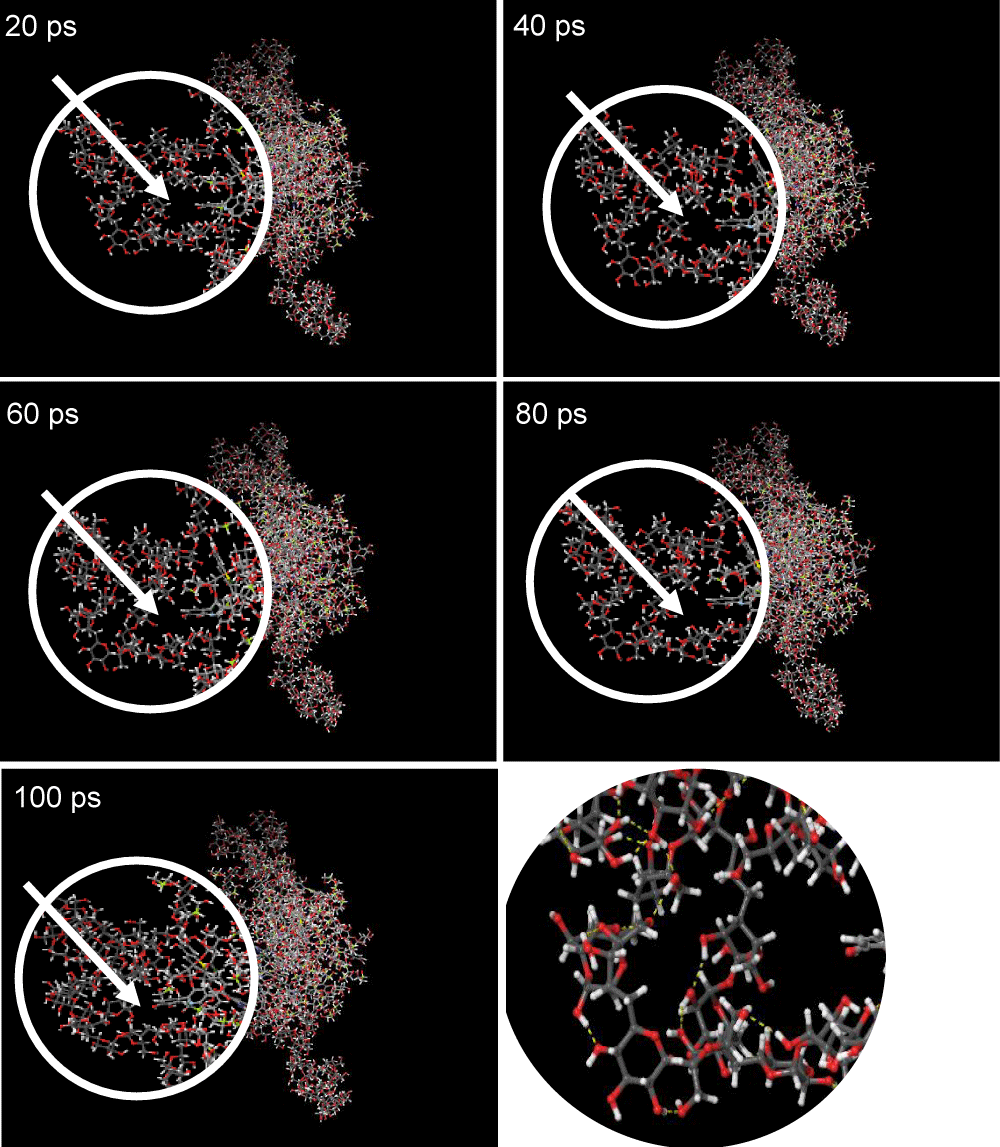
Figure 4: AZ17 Set Structure Visualization Over 20-100 ps.
ANOVA (Analysis of Variance)
Data from the dynamics of 8 pairs from molecular dynamics simulations were carried out ANOVA analysis to find out the relationship between the variables of the sequence of solution composition, namely the simulated set and time to response potential energy values. The results of the ANOVA analysis conducted are listed in Table 2.
| Table 2: ANOVA Results of Time Variables and Potential Energy. | |||||
| Source | DF | Adj SS | Adj MS | F-Value | p - value |
| Set | 2 | 73308 | 36654 | 4.12 | 0.059 |
| Time | 4 | 1887692 | 471923 | 53.06 | 0 |
| Error | 8 | 71148 | 8893 | ||
| Total | 14 | 2032148 | |||
Based on the ANOVA data in Table 2, it can be seen that the sequence factor of solution composition, namely the simulated set, has a value of 0.059 so that the p - value > 0.05, then the set factor has no real effect on the response of the potential energy value. The time factor has a value of 0.000 so that the p - value < 0.05 then the time factor has a real effect on the response of the potential energy value.
Tukey pairwise test
The results of ANOVA analysis from the dynamics data of 8 pairs were then further tested using the Tukey Pairwise Test method with a significance level of 95% (p < 0.05). The results of the Tukey Pairwise Test conducted are listed in Tables 3,4.
| Table 3: Tukey Pairwise Test Results Using Set Factor On 95% Significance Level. | |||
| Set | N | Mean | Grouping |
| AZ17 | 5 | 77480.3 | A |
| AP18 | 5 | 77424.9 | A |
| AP17 | 5 | 77312.2 | A |
| Means that do not share a letter are significantly different. | |||
| Table 4: Tukey Pairwise Test Results Using Time Factor On 95% Significance Level. | |||
| Time (ps) | N | Mean | Grouping |
| 20 | 3 | 77985 | A |
| 40 | 3 | 77612.7 | B |
| 60 | 3 | 77284.6 | C |
| 80 | 3 | 77160.5 | CD |
| 100 | 3 | 76986.2 | D |
| Means that do not share a letter are significantly different. | |||
Based on the data from the Tukey Pairwise Test results in Table 3 on the sequence factor of solution composition, namely the simulated set, it can be seen that AZ17, AP18, and AP17 sets are not significantly different from each other.
Based on the data from the Tukey Pairwise Test results in Table 4 on the time factor, it can be seen that the simulation time of 20 ps is significantly different from the time of 40 to 100 ps, as for the simulation time of 40 ps is also significantly different from the time of 20 and 60 to 100 ps, for the simulation time of 60 ps it is significantly different from a time of 20 to 40 ps and 80 to 100 ps, for simulation time 80 ps there is a significant difference from time 20 to 60 ps but not significantly different with time 100 ps, and for simulation time 100 ps is significantly different from time 20 to 60 ps but not significantly different from time 80 ps.
The color pigment of elderberries contains high levels of anthocyanins compared to other berries. So the color change that occurs in the solution is influenced by the reduced anthocyanin levels contained in the solution and the reduction in anthocyanin levels is caused by the diffusion of oxygen which accelerates oxidative reactions in the structure of anthocyanin compounds [5]. The energy minimization results indicate that all bond lengths and angles have values close to the mean value, but some variation is still needed, because the bond can be elongated and the angle can bend when distortion is more desired. A stable conformation has a minimum potential energy function that takes into account other atomic coordinates [6]. Molecular dynamics methods utilize gradients of potential energy that are directly related to the molecular mechanical description of the system, to find pathways close to the minimum energy [7]. The interatomic forces contained in bonds between atoms can be reflected in the potential energy curve so that it can be used to predict the physical and chemical properties of compounds [8]. 3D visualization is very helpful in exploring molecular structure, a deep understanding of 3D structure is needed to understand biological cycles and their relationships so that they cannot be replaced with statistical analysis [9]. The Tukey Test is used to see the difference in energy interactions of individual residues in pairs [10].
The recommended compound mixing sequence is to use the AP18 set, which is as follows: anthocyanin from elderberry followed by potassium sorbate, then glycerin, then zinc picolinate then sodium citrate, then citric acid, then sucrose, and the last is xanthan gum. This set was chosen because it has a fairly low potential energy and it can be proven that the visualization of the structure of this set tends to be more stable over time during molecular dynamics simulations.
- Palsson B. The challenges of in Silico Biology. Nature Biotechnology. 2000; 18(11):1147-1150. https://doi.org/10.1038/81125
- van Gunsteren WF, Dolenc J, Mark AE. Molecular simulation as an aid to experimentalists. Curr Opin Struct Biol. 2008 Apr;18(2):149-53. doi: 10.1016/j.sbi.2007.12.007. Epub 2008 Feb 14. PMID: 18280138.
- Milbury PE, Cao G, Prior RL, Blumberg J. Bioavailablility of elderberry anthocyanins. Mech Ageing Dev. 2002 Apr 30;123(8):997-1006. doi: 10.1016/s0047-6374(01)00383-9. PMID: 12044949.
- Hubbermann EM, Heins A, Stöckmann H, Schwarz K. Influence of acids, salt, sugars, and hydrocolloids on the color stability of anthocyanin-rich black currant and elderberry concentrates. European Food Research and Technology. 2005; 223(1): 83–90. https://doi.org/10.1007/s00217-005-0139-2
- Baeza R, Sánchez V, Salierno G, Molinari F, López P, Chirife J. Storage stability of anthocyanins in freeze-dried elderberry pulp using low proportions of encapsulating agents. Food Sci Technol Int. 2021 Mar;27(2):135-144. doi: 10.1177/1082013220937867. Epub 2020 Jul 12. PMID: 32659122.
- Levitt M, Lifson S. Refinement of protein conformations using a macromolecular energy minimization procedure. J Mol Biol. 1969 Dec 14;46(2):269-79. doi: 10.1016/0022-2836(69)90421-5. PMID: 5360040.
- Adcock SA, McCammon JA. Molecular dynamics: survey of methods for simulating the activity of proteins. Chem Rev. 2006 May;106(5):1589-615. doi: 10.1021/cr040426m. PMID: 16683746; PMCID: PMC2547409.
- Padmavathi DA. Potential Energy Curves & AMP; material properties. Materials Sciences and Applications. 2011; 02(02): 97–104. https://doi.org/10.4236/msa.2011.22013
- Byška J, Trautner T, Marques SM, Damborský J, Kozlíková B, Waldner M. Analysis of long molecular dynamics simulations using interactive focus+context visualization. Computer Graphics Forum. 2019; 38(3): 441–453. https://doi.org/10.1111/cgf.13701
- Biswas R, Ghosh S, Bagchi A. A structural perspective on the interactions of TRAF6 and Basigin during the onset of melanoma: A molecular dynamics simulation study. J Mol Recognit. 2017 Nov;30(11). doi: 10.1002/jmr.2643. Epub 2017 Jun 14. PMID: 28612997.