Figure 8
Statistical and equation model analysis on COVID-19
Bin Zhao* and Jinming Cao
Published: 03 July, 2020 | Volume 4 - Issue 1 | Pages: 005-012
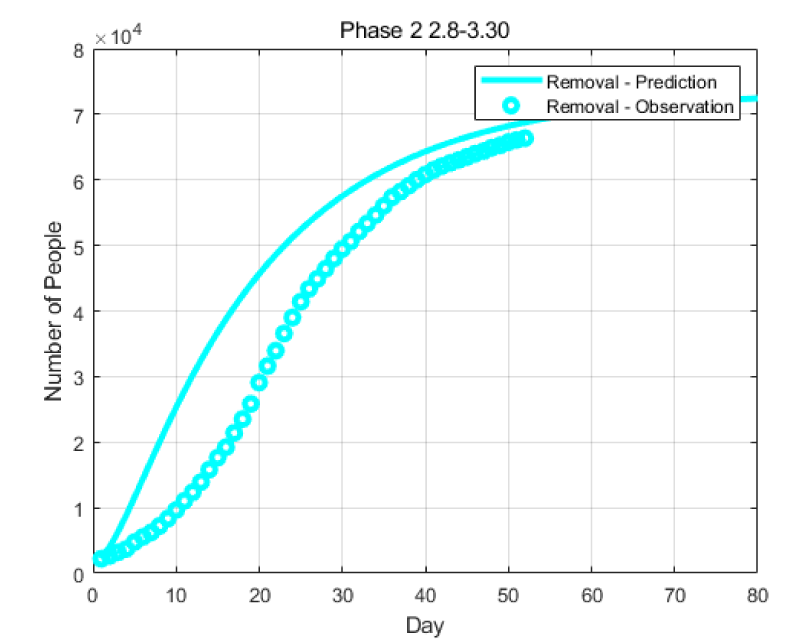
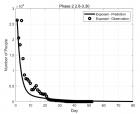
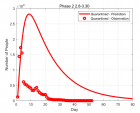
Figure 8:
Result of curve fitting for the Removal R(t) in Phase 2 (2020.2.8 - 2020.3.30).
Read Full Article HTML DOI: 10.29328/journal.abb.1001016 Cite this Article Read Full Article PDF
More Images
Similar Articles
-
Statistical and equation model analysis on COVID-19Bin Zhao*,Jinming Cao. Statistical and equation model analysis on COVID-19. . 2020 doi: 10.29328/journal.abb.1001016; 4: 005-012
-
Can the Wondfo® SARS-CoV-2 IgM/IgG antibodies be used as a rapid diagnostic test?Makson Gleydson Brito De Oliveira*,Lysandro Pinto Borges,Daniela Raguer Valadão de Souza,Kezia Alves Dos Santos,Luana Heimfarth. Can the Wondfo® SARS-CoV-2 IgM/IgG antibodies be used as a rapid diagnostic test?. . 2020 doi: 10.29328/journal.abb.1001017; 4: 013-017
-
Packaging challenge for COVID-19 drugAnupam Chand*. Packaging challenge for COVID-19 drug. . 2019 doi: 10.29328/journal.abb.1001019; 4: 028-036
-
Hypertension and sex related differences in mortality of COVID-19 infection: A systematic review and Meta-analysisProbir Kumar Ghosh*,Mohammad Manir Hossain Mollah,ABM Alauddin Chowdhury,Nazmul Alam,Golam Dostogir Harun. Hypertension and sex related differences in mortality of COVID-19 infection: A systematic review and Meta-analysis. . 2020 doi: 10.29328/journal.abb.1001020; 4: 037-043
-
Antimicrobial resistance of Klebsiella pneumoniae strains isolated from urine in hospital patients and outpatientsZeljko Cvetnić*,Maja Ostojic,Mahir Hubana,Marija Cvetnić,Miroslav Benić. Antimicrobial resistance of Klebsiella pneumoniae strains isolated from urine in hospital patients and outpatients. . 2021 doi: 10.29328/journal.abb.1001021; 5: 001-007
-
Sequence-independent single-primer-amplification (SISPA) as a screening technique for detecting unexpected RNA viral adventitious agents in cell culturesBehnam Alirezaie*,Davood Bahador,Ashraf Mohammadi,Abolhasan Foroughi. Sequence-independent single-primer-amplification (SISPA) as a screening technique for detecting unexpected RNA viral adventitious agents in cell cultures . . 2021 doi: 10.29328/journal.abb.1001022; 5: 008-012
-
OPEN and CLOSED state of SPIKE SARS-COV-2: relationship with some integrin binding. A biological molecular approach to better understand the coagulant effectLuisetto M*,Khaled Edbey,Mashori GR,Yesvi AR,Latyschev OY. OPEN and CLOSED state of SPIKE SARS-COV-2: relationship with some integrin binding. A biological molecular approach to better understand the coagulant effect . . 2021 doi: 10.29328/journal.abb.1001028; 5: 049-056
-
Diagnostic evaluation of nasopharyngeal swab and saliva kits against SARS-CoV-2: Adequate rapid screening is deemed necessary to overcome COVID-19 PandemicMuhammad Danish Yaqoob,Muhammad Abdul Ahad Khawaja,Qurat-ul-Ain Amjad,Atika Waseem,Kashmala Kanwal,Haleema Nadeem,Madiha Munir,Syeda Mushiat Zahra,Zahra Zahid Piracha,Umar Saeed*. Diagnostic evaluation of nasopharyngeal swab and saliva kits against SARS-CoV-2: Adequate rapid screening is deemed necessary to overcome COVID-19 Pandemic. . 2022 doi: 10.29328/journal.abb.1001032; 6: 010-013
-
Diagnostic evaluation of nasopharyngeal swab and saliva kits against SARS-CoV-2: Adequate rapid screening is deemed necessary to overcome COVID-19 PandemicMuhammad Danish Yaqoob. Diagnostic evaluation of nasopharyngeal swab and saliva kits against SARS-CoV-2: Adequate rapid screening is deemed necessary to overcome COVID-19 Pandemic. . -0001 doi: 10.29328/journal.abb.1001032; 6: 010-013
Recently Viewed
-
Artificial Intelligence (AI) in the Chemical Field: Innovation and Risk EvaluationLuisetto M*,Edbey K,Mashori GR,Hamid GH,Gadama GP,Cabianca l,Latyshev OY. Artificial Intelligence (AI) in the Chemical Field: Innovation and Risk Evaluation. Ann Adv Chem. 2025: doi: 10.29328/journal.aac.1001057; 9: 027-033
-
Regulation of Fear Behavior by Microcircuits within the Mouse AmygdalaCheng Wei*,Wen Yao*. Regulation of Fear Behavior by Microcircuits within the Mouse Amygdala. J Neurosci Neurol Disord. 2025: doi: 10.29328/journal.jnnd.1001105; 9: 001-009
-
Pyridostigmine-Induced Status Epilepticus Rat Model Was Resistant to Increasing Doses of Ramipril: The Latter Triggered Epileptogenesis, Arrhythmia, and Cardiac Ischemia in a Dose-Dependent MannerSherine Abdelmissih*,Monica Gamal,Kerollos M Naeem. Pyridostigmine-Induced Status Epilepticus Rat Model Was Resistant to Increasing Doses of Ramipril: The Latter Triggered Epileptogenesis, Arrhythmia, and Cardiac Ischemia in a Dose-Dependent Manner. J Neurosci Neurol Disord. 2025: doi: 10.29328/journal.jnnd.1001106; 9: 010-027
-
An Observational Study on Clinical Outcome and Predictors of Traumatic Cervical Injury at a Tertiary Care FacilitySurendra Saini,Ankit Prajapati,Ina Bahl*,Deepika Gehlot,Namita Prajapati. An Observational Study on Clinical Outcome and Predictors of Traumatic Cervical Injury at a Tertiary Care Facility. J Neurosci Neurol Disord. 2025: doi: 10.29328/journal.jnnd.1001107; 9: 028-038
-
A Comparative Study of Metoprolol and Amlodipine on Mortality, Disability and Complication in Acute StrokeJayantee Kalita*,Dhiraj Kumar,Nagendra B Gutti,Sandeep K Gupta,Anadi Mishra,Vivek Singh. A Comparative Study of Metoprolol and Amlodipine on Mortality, Disability and Complication in Acute Stroke. J Neurosci Neurol Disord. 2025: doi: 10.29328/journal.jnnd.1001108; 9: 039-045
Most Viewed
-
Feasibility study of magnetic sensing for detecting single-neuron action potentialsDenis Tonini,Kai Wu,Renata Saha,Jian-Ping Wang*. Feasibility study of magnetic sensing for detecting single-neuron action potentials. Ann Biomed Sci Eng. 2022 doi: 10.29328/journal.abse.1001018; 6: 019-029
-
Evaluation of In vitro and Ex vivo Models for Studying the Effectiveness of Vaginal Drug Systems in Controlling Microbe Infections: A Systematic ReviewMohammad Hossein Karami*, Majid Abdouss*, Mandana Karami. Evaluation of In vitro and Ex vivo Models for Studying the Effectiveness of Vaginal Drug Systems in Controlling Microbe Infections: A Systematic Review. Clin J Obstet Gynecol. 2023 doi: 10.29328/journal.cjog.1001151; 6: 201-215
-
Prospective Coronavirus Liver Effects: Available KnowledgeAvishek Mandal*. Prospective Coronavirus Liver Effects: Available Knowledge. Ann Clin Gastroenterol Hepatol. 2023 doi: 10.29328/journal.acgh.1001039; 7: 001-010
-
Causal Link between Human Blood Metabolites and Asthma: An Investigation Using Mendelian RandomizationYong-Qing Zhu, Xiao-Yan Meng, Jing-Hua Yang*. Causal Link between Human Blood Metabolites and Asthma: An Investigation Using Mendelian Randomization. Arch Asthma Allergy Immunol. 2023 doi: 10.29328/journal.aaai.1001032; 7: 012-022
-
An algorithm to safely manage oral food challenge in an office-based setting for children with multiple food allergiesNathalie Cottel,Aïcha Dieme,Véronique Orcel,Yannick Chantran,Mélisande Bourgoin-Heck,Jocelyne Just. An algorithm to safely manage oral food challenge in an office-based setting for children with multiple food allergies. Arch Asthma Allergy Immunol. 2021 doi: 10.29328/journal.aaai.1001027; 5: 030-037

HSPI: We're glad you're here. Please click "create a new Query" if you are a new visitor to our website and need further information from us.
If you are already a member of our network and need to keep track of any developments regarding a question you have already submitted, click "take me to my Query."


